Storing estimated HRFs in snirf files
This notebook estimates the HRF in a finger-tapping experiment by blockaveraging and then stores the result in a snirf file.
[1]:
from pathlib import Path
import tempfile

import matplotlib.pyplot as p
import numpy as np
import xarray as xr
from snirf import Snirf

import cedalion
import cedalion.datasets
import cedalion.io
import cedalion.nirs

xr.set_options(display_max_rows=3, display_values_threshold=50, display_expand_data=False)
np.set_printoptions(precision=4)
Load a finger-tapping dataset
For this demo we load an example finger-tapping recording through cedalion.datasets.get_fingertapping. The file contains a single NIRS element with one block of raw amplitude data.
[2]:
rec = cedalion.datasets.get_fingertapping()
[3]:
# Rename events
rec.stim.cd.rename_events( {
    "1.0" : "control",
    "2.0" : "Tapping/Left",
    "3.0" : "Tapping/Right"
})
Calculate concentrations
[4]:
dpf = xr.DataArray([6, 6], dims="wavelength", coords={"wavelength" : rec["amp"].wavelength})
rec["od"] = - np.log( rec["amp"] / rec["amp"].mean("time") )
rec["conc"] = cedalion.nirs.beer_lambert(rec["amp"], rec.geo3d, dpf)
Frequency filtering and splitting into epochs
[5]:
rec["conc_freqfilt"] = rec["conc"].cd.freq_filter(fmin=0.02, fmax=0.5, butter_order=4)


cf_epochs = rec["conc_freqfilt"].cd.to_epochs(
    rec.stim,  # stimulus dataframe
    ["Tapping/Left", "Tapping/Right"],  # select events
    before=5,  # seconds before stimulus
    after=20,  # seconds after stimulus
)
Blockaveraging to estimate the HRFs
[6]:
# calculate baseline
baseline = cf_epochs.sel(reltime=(cf_epochs.reltime < 0)).mean("reltime")
# subtract baseline
epochs_blcorrected = cf_epochs - baseline

# group trials by trial_type. For each group individually average the epoch dimension
rec["hrf_blockaverage"] = epochs_blcorrected.groupby("trial_type").mean("epoch")

display(rec["hrf_blockaverage"])
<xarray.DataArray 'concentration' (trial_type: 2, chromo: 2, channel: 28,
                                   reltime: 196)> Size: 176kB
[µM] -0.05399 -0.05393 -0.05398 -0.05408 ... -0.005362 -0.005991 -0.007054
Coordinates: (3/6)
  * chromo      (chromo) <U3 24B 'HbO' 'HbR'
  * channel     (channel) object 224B 'S1D1' 'S1D2' 'S1D3' ... 'S8D8' 'S8D16'
    ...          ...
* trial_type (trial_type) object 16B 'Tapping/Left' 'Tapping/Right'Store HRFs
[7]:
tmpdir = tempfile.TemporaryDirectory()
snirf_fname = str(Path(tmpdir.name) / "test.snirf")
[8]:
cedalion.io.snirf.write_snirf(snirf_fname, rec)
Inspect snirf file
[9]:
s = Snirf(snirf_fname)
[10]:
display(s.nirs)
display(s.nirs[0].data)
<iterable of 1 <class 'snirf.pysnirf2.NirsElement'>>
<iterable of 5 <class 'snirf.pysnirf2.DataElement'>>
Stim DataFrame
[11]:
display(s.nirs[0].stim)
<iterable of 4 <class 'snirf.pysnirf2.StimElement'>>
[12]:
cedalion.io.snirf.stim_to_dataframe(s.nirs[0].stim)
[12]:
| onset | duration | value | trial_type | |
|---|---|---|---|---|
| 0 | 61.824 | 5.0 | 1.0 | control |
| 1 | 87.296 | 5.0 | 1.0 | control |
| 2 | 181.504 | 5.0 | 1.0 | control |
| 3 | 275.712 | 5.0 | 1.0 | control |
| 4 | 544.640 | 5.0 | 1.0 | control |
| ... | ... | ... | ... | ... |
| 87 | 2234.112 | 5.0 | 1.0 | Tapping/Right |
| 88 | 2334.848 | 5.0 | 1.0 | Tapping/Right |
| 89 | 2362.240 | 5.0 | 1.0 | Tapping/Right |
| 90 | 2677.504 | 5.0 | 1.0 | Tapping/Right |
| 91 | 2908.032 | 5.0 | 1.0 | Tapping/Right |
92 rows × 4 columns
MeasurementList DataFrame
[13]:
for i_data in range(len(s.nirs[0].data)):
    df_ml = cedalion.io.snirf.measurement_list_to_dataframe(
        s.nirs[0].data[i_data].measurementList, drop_none=True
    )
    display(df_ml.head(3))
    display(df_ml.tail(3))
| sourceIndex | detectorIndex | wavelengthIndex | dataType | dataUnit | |
|---|---|---|---|---|---|
| 0 | 1 | 1 | 1 | 1 | volt |
| 1 | 1 | 1 | 2 | 1 | volt |
| 2 | 1 | 9 | 1 | 1 | volt |
| sourceIndex | detectorIndex | wavelengthIndex | dataType | dataUnit | |
|---|---|---|---|---|---|
| 53 | 8 | 15 | 2 | 1 | volt |
| 54 | 8 | 8 | 1 | 1 | volt |
| 55 | 8 | 8 | 2 | 1 | volt |
| sourceIndex | detectorIndex | wavelengthIndex | dataType | dataUnit | dataTypeLabel | |
|---|---|---|---|---|---|---|
| 0 | 1 | 1 | 1 | 99999 | dimensionless | dOD |
| 1 | 1 | 1 | 2 | 99999 | dimensionless | dOD |
| 2 | 1 | 9 | 1 | 99999 | dimensionless | dOD |
| sourceIndex | detectorIndex | wavelengthIndex | dataType | dataUnit | dataTypeLabel | |
|---|---|---|---|---|---|---|
| 53 | 8 | 15 | 2 | 99999 | dimensionless | dOD |
| 54 | 8 | 8 | 1 | 99999 | dimensionless | dOD |
| 55 | 8 | 8 | 2 | 99999 | dimensionless | dOD |
| sourceIndex | detectorIndex | dataType | dataUnit | dataTypeLabel | |
|---|---|---|---|---|---|
| 0 | 1 | 1 | 99999 | micromolar | HbO |
| 1 | 1 | 1 | 99999 | micromolar | HbR |
| 2 | 1 | 9 | 99999 | micromolar | HbO |
| sourceIndex | detectorIndex | dataType | dataUnit | dataTypeLabel | |
|---|---|---|---|---|---|
| 53 | 8 | 15 | 99999 | micromolar | HbR |
| 54 | 8 | 8 | 99999 | micromolar | HbO |
| 55 | 8 | 8 | 99999 | micromolar | HbR |
| sourceIndex | detectorIndex | dataType | dataUnit | dataTypeLabel | |
|---|---|---|---|---|---|
| 0 | 1 | 1 | 99999 | micromolar | HbO |
| 1 | 1 | 1 | 99999 | micromolar | HbR |
| 2 | 1 | 9 | 99999 | micromolar | HbO |
| sourceIndex | detectorIndex | dataType | dataUnit | dataTypeLabel | |
|---|---|---|---|---|---|
| 53 | 8 | 15 | 99999 | micromolar | HbR |
| 54 | 8 | 8 | 99999 | micromolar | HbO |
| 55 | 8 | 8 | 99999 | micromolar | HbR |
| sourceIndex | detectorIndex | dataType | dataUnit | dataTypeLabel | dataTypeIndex | |
|---|---|---|---|---|---|---|
| 0 | 1 | 1 | 99999 | micromolar | HRF HbO | 3 |
| 1 | 1 | 1 | 99999 | micromolar | HRF HbR | 3 |
| 2 | 1 | 9 | 99999 | micromolar | HRF HbO | 3 |
| sourceIndex | detectorIndex | dataType | dataUnit | dataTypeLabel | dataTypeIndex | |
|---|---|---|---|---|---|---|
| 109 | 8 | 15 | 99999 | micromolar | HRF HbR | 4 |
| 110 | 8 | 8 | 99999 | micromolar | HRF HbO | 4 |
| 111 | 8 | 8 | 99999 | micromolar | HRF HbR | 4 |
[14]:
s.close()
Read HRFs from snirf file
Note: read_snirf names the time dimension time whereas in blockaverage it was called reltime. Need to agree on a convention.
[15]:
hrf_recs = cedalion.io.read_snirf(snirf_fname)
display(hrf_recs)
[<Recording | timeseries: ['amp', 'od', 'conc', 'conc_02', 'hrf_conc'], masks: [], stim: ['control', '15.0', 'Tapping/Left', 'Tapping/Right'], aux_ts: [], aux_obj: []>]
[16]:
# the name of the stored blockaverages derives from the datatype (HRF) and the type of data (concentration)
read_blockaverage = hrf_recs[0]["hrf_conc"]
display(read_blockaverage)
<xarray.DataArray (channel: 28, chromo: 2, trial_type: 2, time: 196)> Size: 176kB
[µM] -0.05399 -0.05393 -0.05398 -0.05408 ... -0.005362 -0.005991 -0.007054
Coordinates: (3/7)
  * time        (time) float64 2kB -4.992 -4.864 -4.736 ... 19.71 19.84 19.97
    samples     (time) int64 2kB 0 1 2 3 4 5 6 7 ... 189 190 191 192 193 194 195
    ...          ...
  * trial_type  (trial_type) <U13 104B 'Tapping/Left' 'Tapping/Right'
Attributes:
data_type_group: processed HRF concentrationsAssert that the written and read HRFs are identical.
[17]:
assert (read_blockaverage.rename({"time" : "reltime"}) == rec["hrf_blockaverage"]).all()
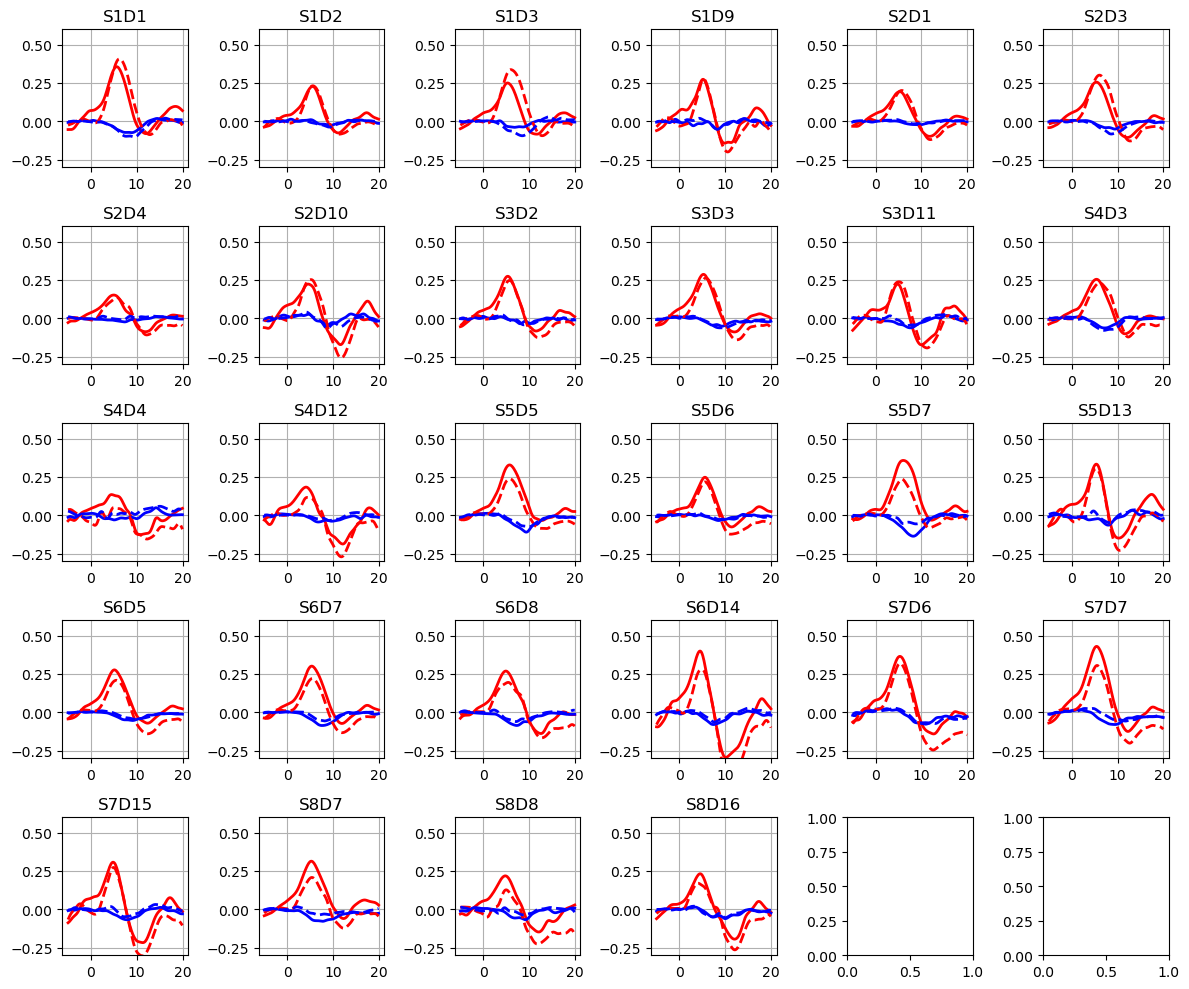
Plot the HRFs
[18]:
ba = read_blockaverage

f,ax = p.subplots(5,6, figsize=(12,10))
ax = ax.flatten()
for i_ch, ch in enumerate(ba.channel.values):
    for ls, trial_type in zip(["-", "--"], ba.trial_type):
        ax[i_ch].plot(ba.time, ba.sel(chromo="HbO", trial_type=trial_type, channel=ch), "r", lw=2, ls=ls)
        ax[i_ch].plot(ba.time, ba.sel(chromo="HbR", trial_type=trial_type, channel=ch), "b", lw=2, ls=ls)
    ax[i_ch].grid(1)
    ax[i_ch].set_title(ch)
    ax[i_ch].set_ylim(-.3, .6)

p.tight_layout()
Tidy up
[19]:
del tmpdir